Lotus
Spreadsheet Graphs of Power and Speed 4th Dec
1995
In the News Correspondent's Notes of the February issue,
Denis draws our attention
to the road tests of the 2.5 litre and 3.5 litre using normal and war
time pool petrol.
In the tests he cites, the 3.5 litre has lost about 25 to 30% of its
normal performance
from the retarded ignition setting. A 1940 Autocar test
reveals a similar loss but on
this occasion on the 2.5 litre model. Thinking about these tests led me
to look for other
performance comparisons and to play with some models on the ubiquitous
Lotus
spreadsheet, this time all with the same fuel quality.
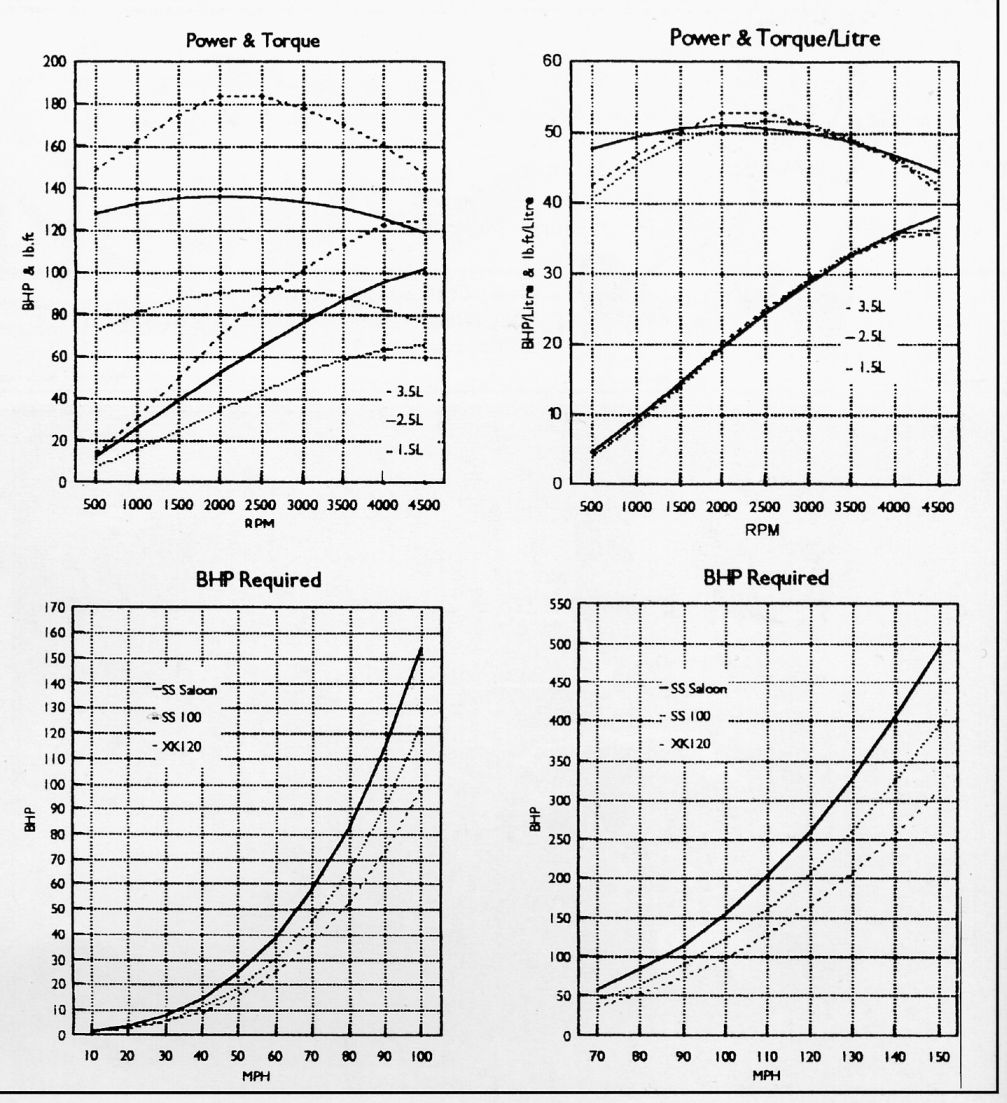
My starting point was the power and torque graphs for the three SS
overhead valve
engines. The two larger engines are very similar in specification,
sharing the same valve
timing and having porting in very much the same relationship to their
cubic capacities.
From this similarity you might expect the performance graphs to be
scaled versions of
each other, so I was surprised that the 2.5 litre torque graph was so
flat when compared
with the 3.5 litre. The BHP curves are fairly directly related to the
torque graphs and
the dominance of RPM tends to mask the relatively small changes in
torque.
Normalising these graphs by the cubic capacity the similarity of all
three engines becomes
apparent. Whilst the 2.5 litre's flatter torque graph can be seen it is
clear that the 1.5 litre
does not loose out despite having more conservative valve timing.
Comparing the relative throat area of the carburettors, the 1.5 litre
is about 8% greater
than that of the 3.5 litre and the 2.5 litre emerges with a
further 12% on top of that of
the 1.5. The porting of the 1.5 litre and the 2.5 litre are identical
and the 3.5 litre is only
less in relative terms.
Using some ancient formulae for rolling resistance and wind resistance
I then looked
at the BHP required to achieve a particular top speed. Whilst these
graphs should
not be taken as definitive models it is possible to have some fun with
them,
speculating on effects of various engines in different bodies.
If for example the XK120 had been fitted with the 3.5 litre OHV then
the 125 BHP
would probably have given a top speed of about 110 MPH. If we assume
that the
drag characteristics of the Mark V are similar to the SS saloon (which
road test results
suggest they are) then that prototype Mark V that was fitted with the
XK120 engine
probably had a top speed of just over 100MPH.
I'm sure that you can think of many other interesting and bizarre
combinations. Whilst
there are small differences in the drag of the three SS saloons these
are too small to
worry about in this model.
I also tried modelling the top gear accelerations of the SS saloons
using the drag, weight
torque characteristics and gearing. Whilst this model fitted quite well
with contemporary
road test data on individual cars and scaled quite well between the SS
saloons it failed
to work with more extreme changes of data. Perhaps other Lotus freaks
would like to
try their hand.

.JPG)